¶ Power Gantt
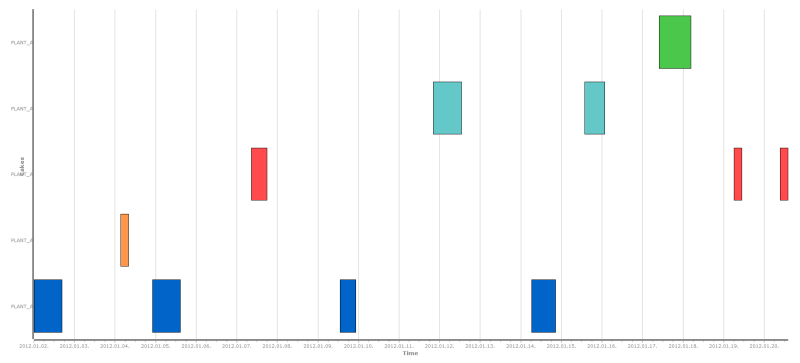
As you can see on the screenshot below, with the help of the power gantt you can illustrate the schedule of a project.
This means that it is able to show the starting and ending times of a project's different elements.
It differs from the simple gantt graph in the fact that it can be animated and edited.
To create a similar graph, follow the opportunities given by the tabs: