Main Tab
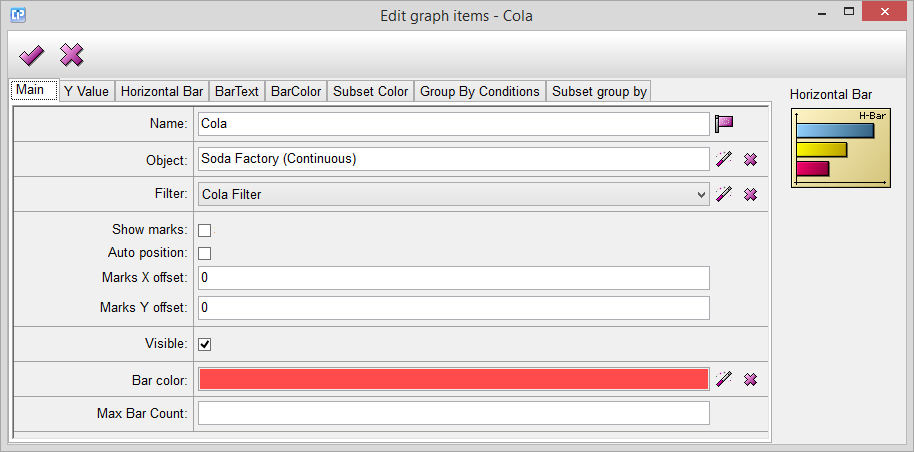
Name - The name of your graph item, you cannot leave it empty.
Object - By clicking on the  button, the Select Object Dialog will appear. From here, you can select the object from which you want to import your data to the graph.
Filter - By clicking on the button, the Select Filter Dialog will appear. From here, you can choose or create a filter which is going to filter your data from your selected object.
Show marks - If you enable this feature, the values will appear on the bars as well.
Auto position - If you grab and move the final picture of your graph, the marks will automatically position themselves to remain visible and attached to the right column. This feature works only if the show marks option is enabled.
Marks X offset - With the help of this feature, you can specify the position of the marks compared to the columns and the X axis. Use negative numbers to aim for the left part of the column and positive numbers to position the marks in the right part.
Marks Y offset - With the help of this feature, you can specify the position of the marks compared to the columns and the Y axis. Use negative numbers to position the marks higher than the position of the horizontal columns compared to the Y axis and positive numbers to position the marks lower.
Visible - If you do not mark this feature, your graph will be invisible.
Bar color - By clicking on the button, the Color Dialog will appear with the help of which you can choose a color for the bars of your graph.
Max bar count - You can specify how many of the top values you want to see on the graph.