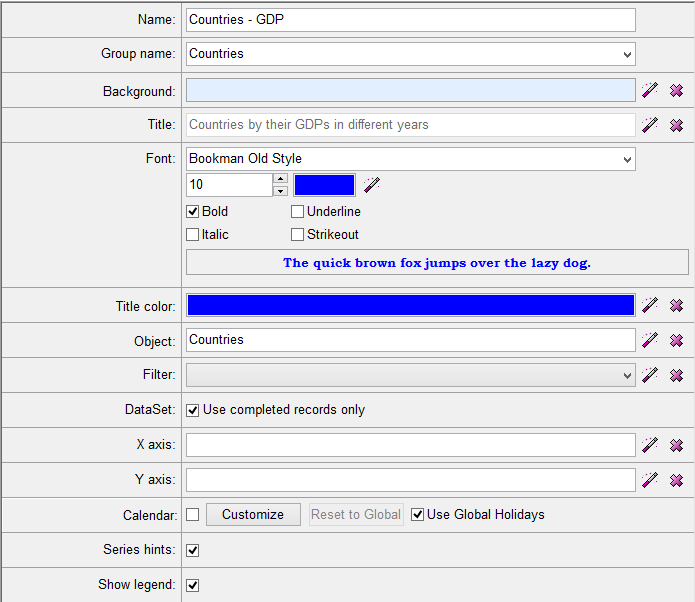
- Name - Shows the name of your graph pack, it must be filled out.
- Group name - By specifying a group name, you can group your graphs according to a similar pattern.
- Background - You can choose a background color for your graph by clicking on the
 button. To redo your color, click on the
 button.
- Title - The title of your graph will be visible when your graph pack is created. To add a title, click on the button. To redo your title, click on the button.
- Font - This feature enables you to change the font style and font size of your graph's title.
- Title color - This feature is responsible for the color of the appearing title of your graph.
- Object - By clicking on the button, you can choose an object on which your graph pack will work. The selected object will give the source data for your graph. To redo your selection, click on the button.
- Filter - By clicking on the button, you can assign a filter to your graph pack. This feature will filter the data from your selected object. To redo your selection, click on the button.
- DataSet - The dataset feature can assure you the usages of completed records only in your graph pack.
- X axis - If you want a text to appear on your X axis when your graph is done, click on the button. To redo your change, click on the button.
- Y axis - If you want a text to appear on your Y axis when your graph is done, click on the button. To redo your change, click on the button.
- Calendar - With the help of this feature, you can create an axis on which your calendar can be visualized. By clicking on the Customize button, you can edit the calendar axis settings. You also have the possibility to activate the recognition of global holidays.
- Series hints - If you enable this feature, hints will be shown on your graph.
- Show legend - If you enable this feature, the legend will appear on your graph.