¶ DownTime Statistics General Tab
¶ Main
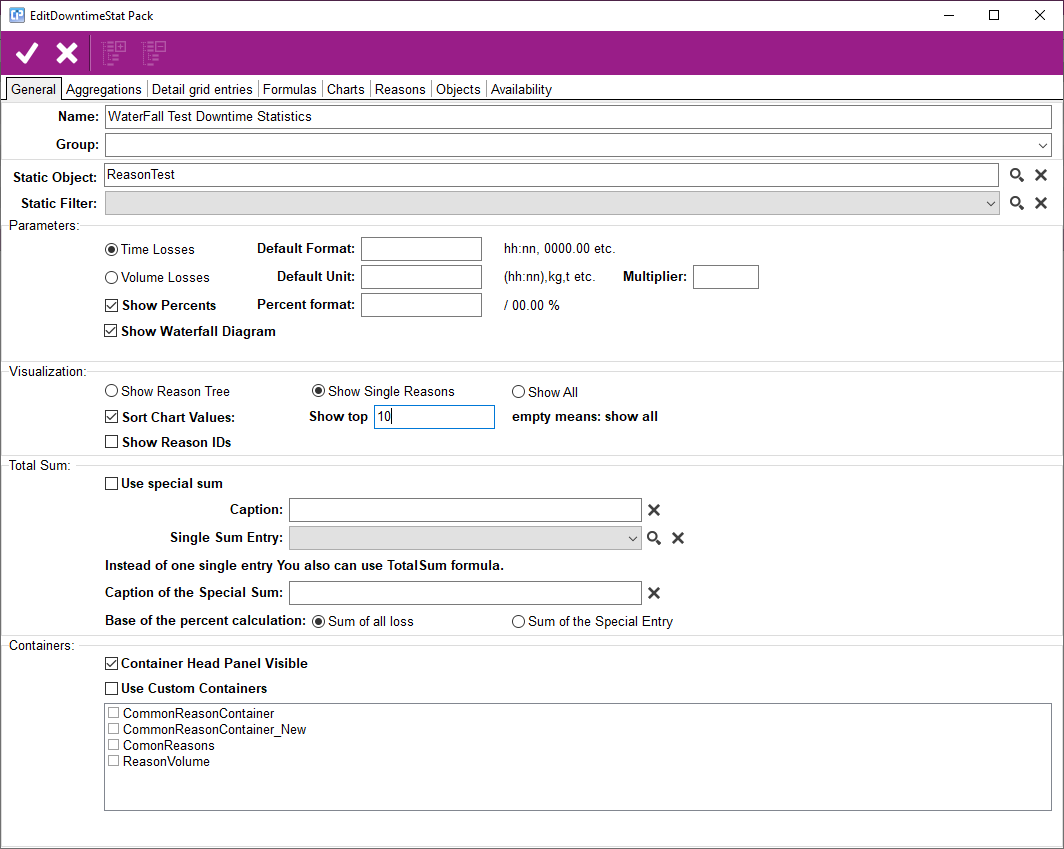
Name:Name of the DownTime Statistics
Group: Group of the DownTime Statistics
Static Object: It will be used a a root object to generate the numbers. If not specified, the current external object will be used.
Static Filter: The main filter of the Statistics, it carried to sublevels also
¶ Parameters
The statistics can generate Time or Volume base statistics. (e.g Hours vs Produced Amount).
It is possible to set individual Format and Unit for the shown values.
Multiplier: it is possible to modify the calculated downtime with a constant multiplier
Show Percents: the percents of the downtime losses and categories will be calculated. As default the percents based on total loss, but if a special sum specified: the percentages will use as a base.
¶ Show WaterFall
If it set, the DownTime Statistics will show the waterfall diagram of the losses.
Each level should show the appropriate details (siblings one on the same level) of the downtimes.
WaterFallBase (BDP) formula has to be specified to show the diagram.
It should collect the BDP values from the records.
If the DownTime is time based, it will be the end of the diagram. (real production time is probably more)
If the DownTime is volume based, it will be the start of the diagram. (real production volume is probably less)
WaterFallProduction formula has to be specified to show the diagram
The formula should collect the real production times/volumes from the records.
¶ Visualization of the ReasonTree
Show Reason Tree: the statistics will be shown as a Tree.
Show Single Reasons: Individual (Leaf) reasons will be shown in a list
Show All: every single reasons in tree (also which has no Data) will be shown,good when comparing different trees.
¶ Total Sum
You can decide to have a special Entry for the Total Sum Value. Percentage calculations can base on this number.
e.g. it is useful to see the downtime compared with the total production time.
Total Sum can be an entry, and also available a formula for scripting.
¶ Containers
You can use All available Reason Containers or it is possible to choose individual containers.