¶ Visualization
Visualization can help you to show your data visually.
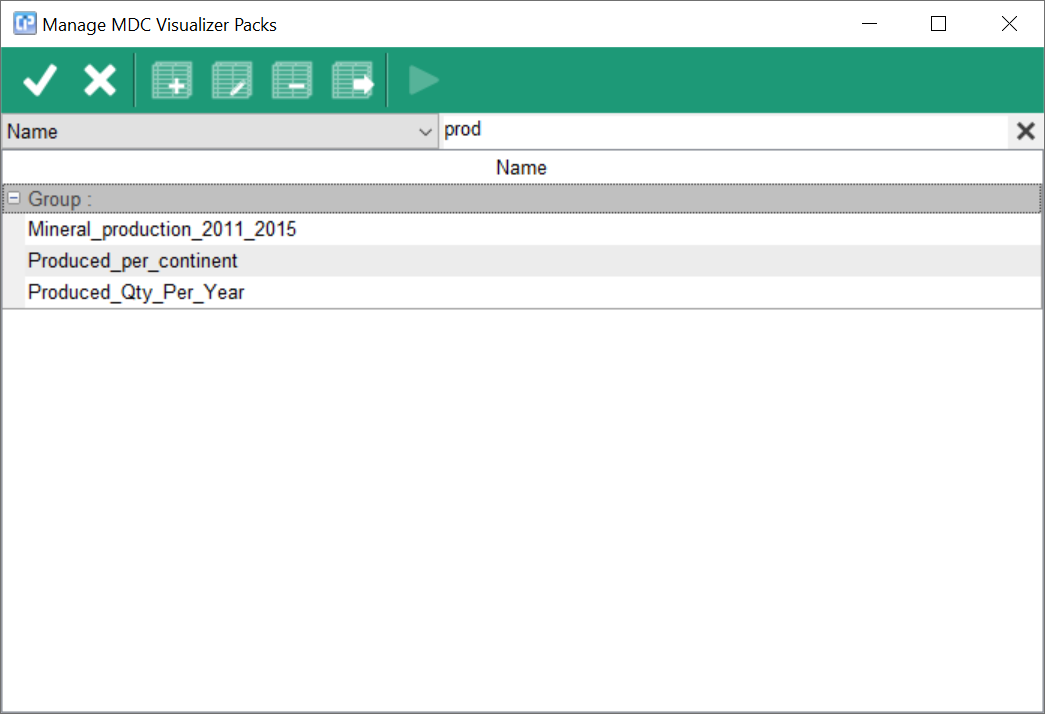
When you click on the Visualization icon on the toolbar, the following window will appear on your screen:
¶ Workaround for entry formating
If you want to see Marks in entry format please use OnGetMarkText event. See also the complete Visualizer formula event reference.
Set it like this.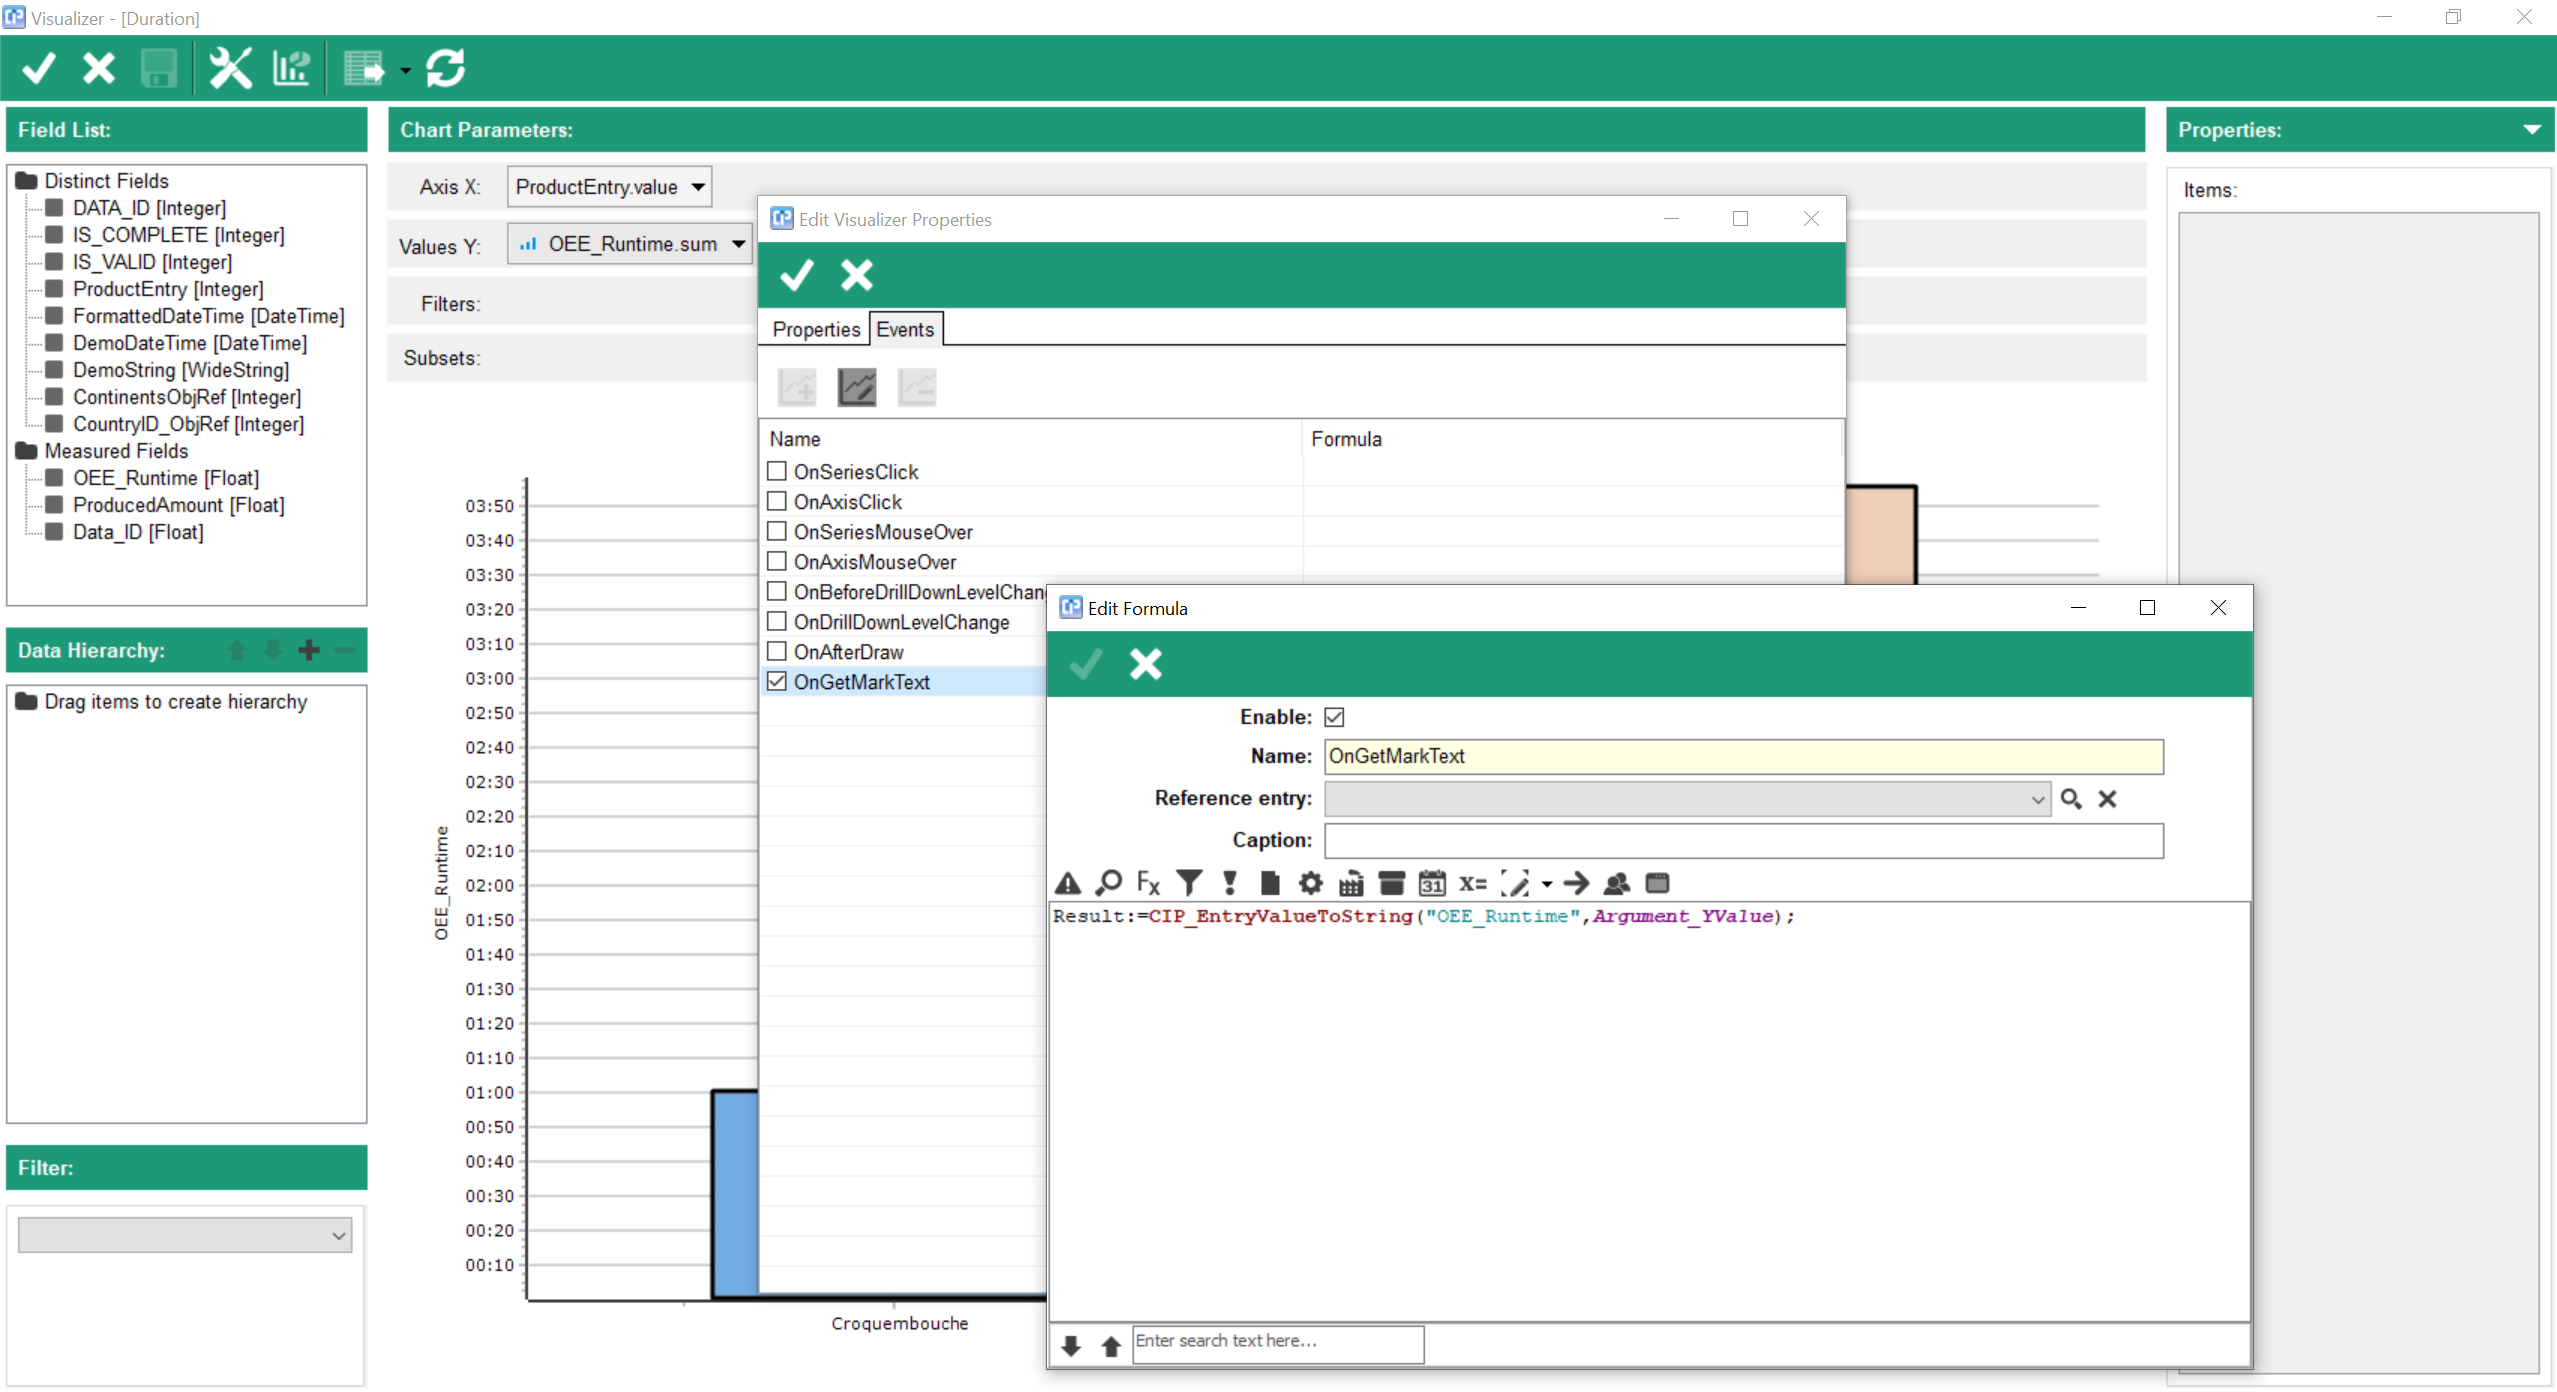
Datetime format on an axis.
If you want to see datetime format on an axis set it like this.
Set the axis format in chart editor (right click Show Chart Editor). Look for the following places:
1) Series->General->Options
Vertical Axis: tick DateTime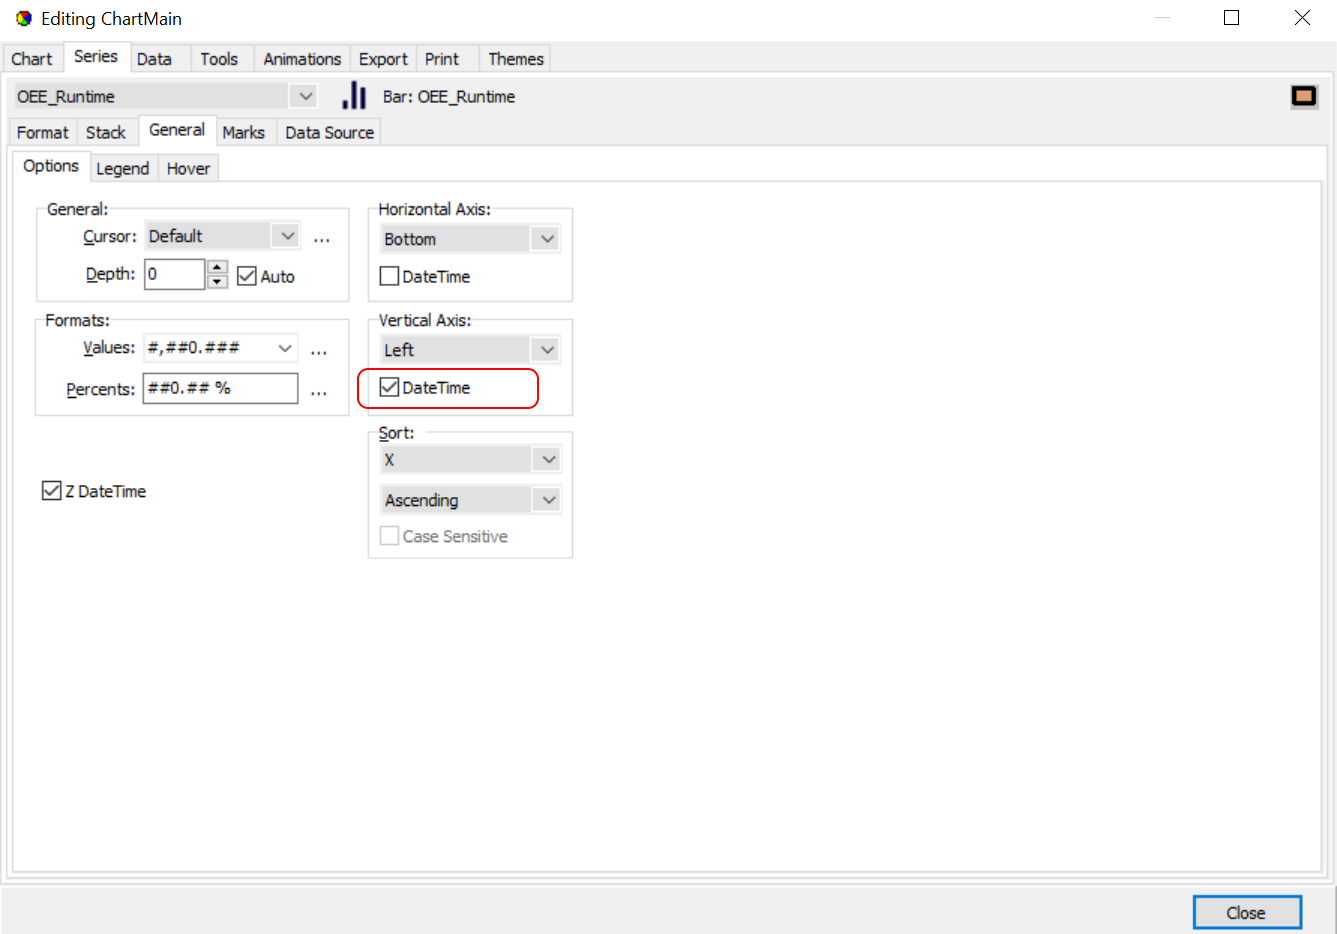
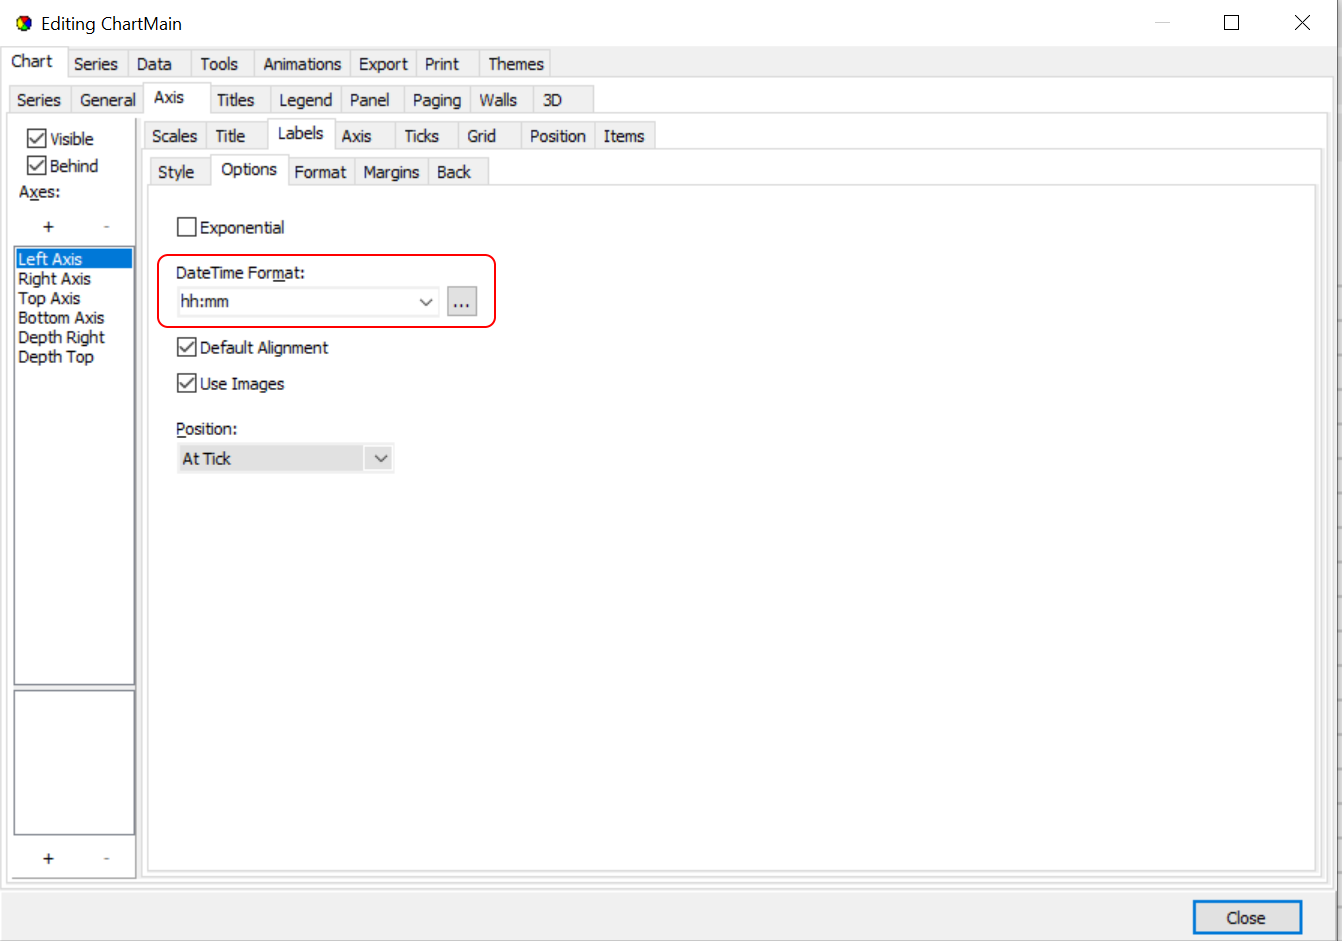
2) Chart->Axis->Labels->Options
DateTime Format: hh:mm