Pie
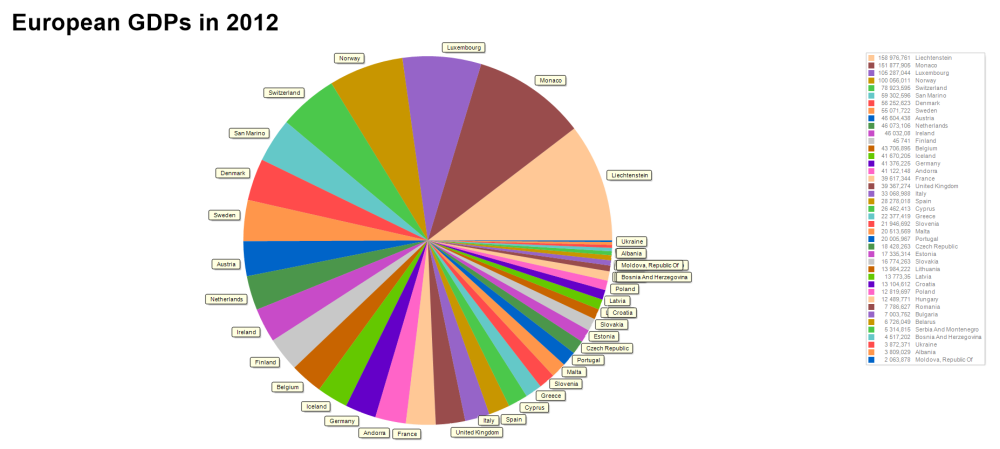
On the screenshot below, you can see the European GDPs in 2012 executed in a pie graph.
If you want to create a similar graph, the following steps might help you:
Pie
On the screenshot below, you can see the European GDPs in 2012 executed in a pie graph.
If you want to create a similar graph, the following steps might help you: